We will use a sales data set to create a Dynamic VBA Dashboard in Excel by changing the data source in real-time.
First, we quickly examine the essential things we must understand to develop a dashboard. Next, we’ll understand how to create amazing and richly visualized charts.
The data table contains information about a company’s sales performance by products. Each series formula in the chart uses names for the category values and the data. Animation is well used if there is a form to be exposed, but we need more: the ability to interact with the source data.
The dashboard must do the following actions: able to stop, go back, and start again. And we will construct a simple animation effect with a loop. To create animations, your data source must change dynamically, which requires a lot of time.
We will see the fundamentals we need to know to build an Excel VBA dashboard and then learn how to create superb and richly visualized reports.
Animated Dynamic Dashboard using VBA
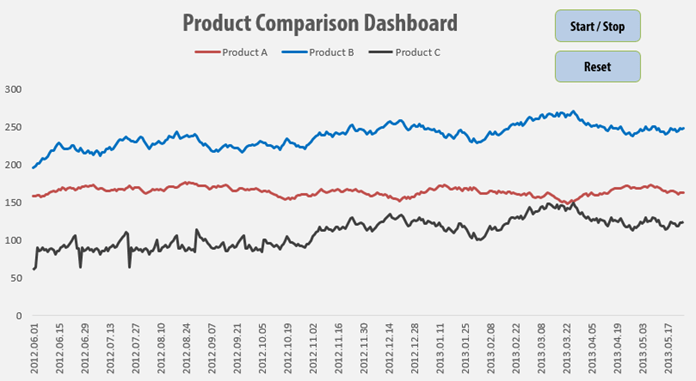
Let’s see what kind of data we’ll use and what the conception will be! We will examine the indicators of three products. And we will do this with the help of a special animated chart analyzing four years.
What makes the dashboard unique is the data visualization because we will be able to review a longer period in a daily breakdown so that the visualization will not disadvantage the understanding.
At the beginning of the article, we mentioned source data; in this picture, you can take a closer look at it. Column ‘A’ contains the date. Columns ‘B’ and ‘D’ are the daily values relating to each product. Columns ‘F’ and ‘G’ contain the most important setting options.
In the ‘Start’ field, we can determine what date the analysis should start. We set the starting date to the first day; we would like to see the differences between the three product’s values from the first day.
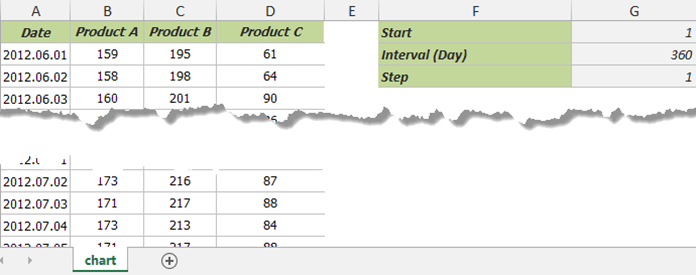
We have to set the interval in our example, 360 days. So, the animation displays a business year in one window. The third freely fillable field is the jump interval.
With this, we set on the chart that one ‘jump’ will correspond to how many days (because of the animation). Based on our experiences, the best solution is to set this value to 1 so that data remains detailed enough but keeps the clarity simple.
In the upper right side of the dynamic VBA dashboard, two ‘Command Button’ can be found. Start / Stop does the starting and stopping of the animation.
Under these, the ‘Reset’ switch sets the value of the starting date to 1. The latter is a little relief; we can call it a comfort service. After we run the animation, we don’t have to reset the timer manually, and it is enough to use this button.
Dynamic VBA Dashboard – Smart and Simple
Now, we know the data visualization subject and get acquainted with the most important switches and settings. A very simple macro makes the static chart dynamic; this is seen in the next picture.
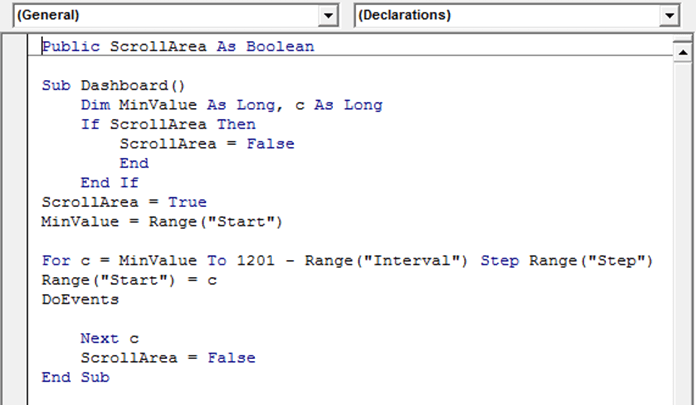
The interaction with the chart will be much easier using this VBA routine. Our dashboard procedure uses a public variable (ScrollArea) to keep track of the animation status. The key to chart animation is to use DoEvents statements.
DoEvents permits control of the OS. Control is returned after the operating system has completed processing the events. The example proves that the VBA programming language can be a useful supplement when creating something new using Excel.
Download the practice file.