25 Actionable Tips for Excel Tables

Use Excel Tables to simplify your work! Learn how to create dynamic ranges with easy-to-read formulas using tables.
In this section you’ll find useful Excel tutorials, Excel Tips quick and effective solutions.
Use Excel Tables to simplify your work! Learn how to create dynamic ranges with easy-to-read formulas using tables.

Our definitive guide will show you 15 ways to clean data in Excel. Learn more about data cleansing through useful examples.

Learn how to use the XLOOKUP function under Excel 2010, Excel 2013, or newer versions. Using a small trick, we keep the backward compatibility.
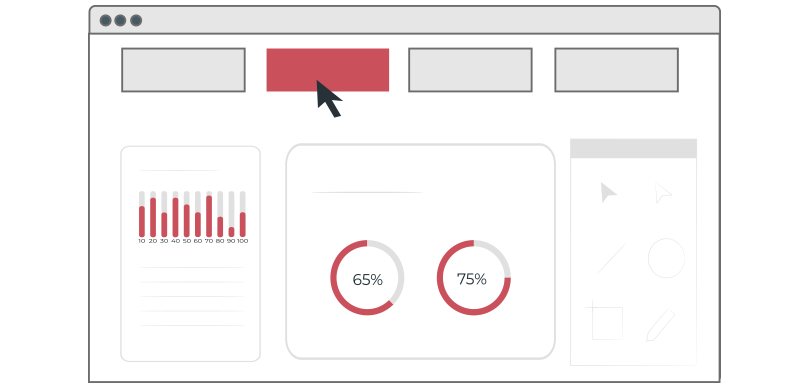
Improve user experience (UX) using the ribbon navigation menu. Learn how to create stunning navigation with minimal programming knowledge.
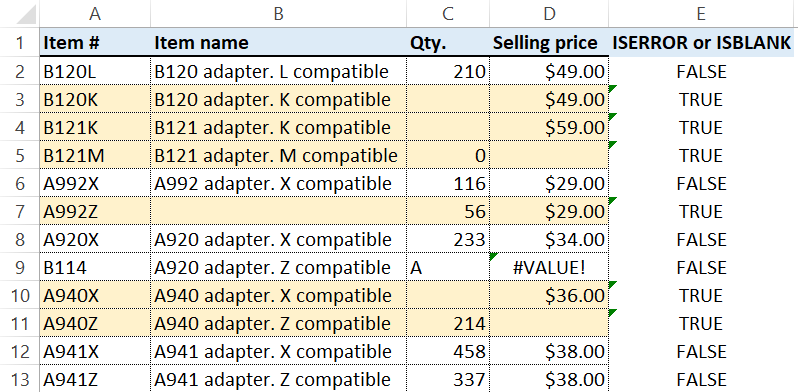
Learn how to find errors in a range using conditional formatting. We will apply a simple formula to identify missing or incorrect data.

A recent Microsoft Office update has caused add-in Ribbon Menu Bars to disappear when Excel is opened. This article explains the possible solutions to fix it.

Today’s article explains everything you need to know about how to install an excel add-in – or plugin, as it’s also known. We’ll show you what it is, why it’s important for Excel, how to install this type of Excel file. Read our step-by-step tutorial on how to install an Excel add-in quickly. Furthermore, download … Read more
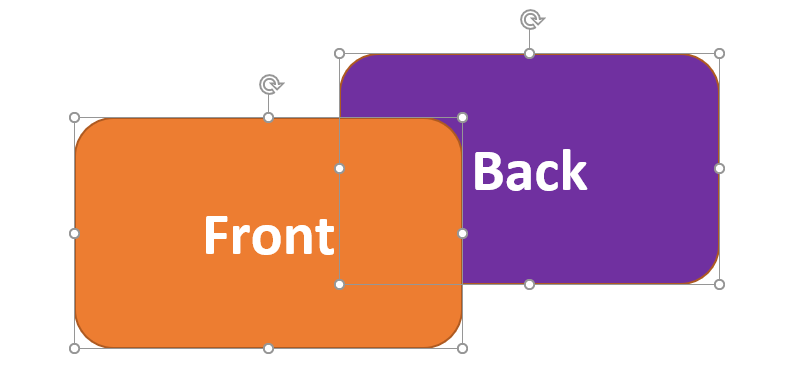
Discover how to align and group shapes in Excel! Learn how to use the ‘bring the front’ and the ‘send to back’ functions. Now that we have explained the role of the mockups in the dashboard design, it is time to talk about the realization. We should know about the mockups they’ve grouped vector objects, … Read more
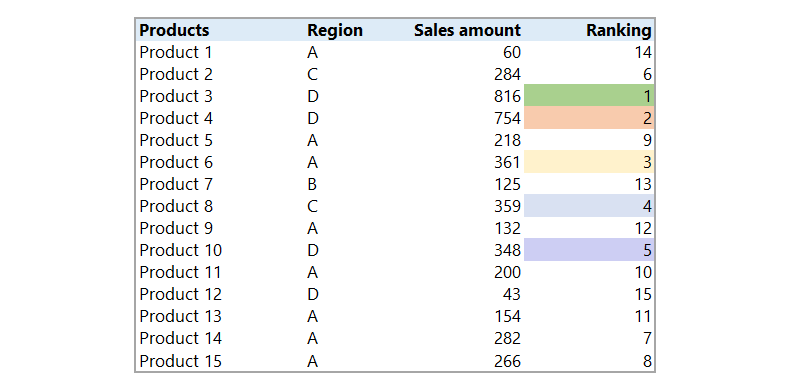
Learn how to use dynamic color ranking in Excel using conditional formatting and RANK function. In this article, we will discover how to apply the Rank function in Excel and where we need to use it in data. Use the RANK formula to return the ranking of any number in the data. Mostly we use … Read more

How to use conditional formatting on charts? Formatting cells is easy in Excel.

Excel Sorting Data Tips – With the help of Excel Sorting Data Tips we looking for solutions for very interesting problems today. How to sort dynamically a list containing two columns (‘Product’ and ‘Sales’ columns) at will only using excel functions? On the second worksheet we will show you a solution based on the on the fly sorting technique. It is well capable of give us help in creating an excel dashboard or other visualization tasks especially when available space is scarce.
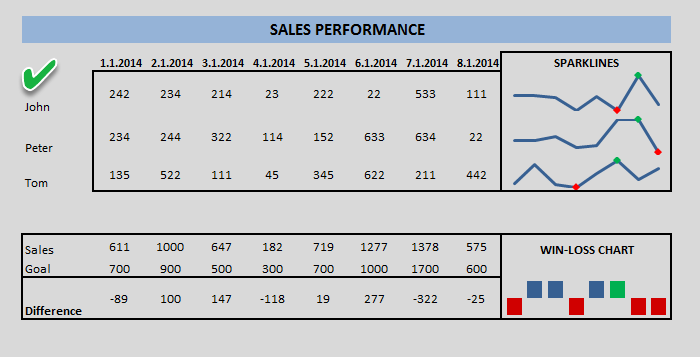
From Excel 2013, you can use a new chart type named sparklines. Sparkline is mini charts located in single cells. Each cell shows a series of data in your range. It helps bring meaning and context to numbers being reported. Select the data and insert chart!
This type of graph – compared with classic chart templates – is meant to be embedded into what they are reporting.
To create new styles, use the Design tab on the ribbon and customize your sparklines to match whatever visual style you need. If you find a space-saving method, use sparklines instead of charts.
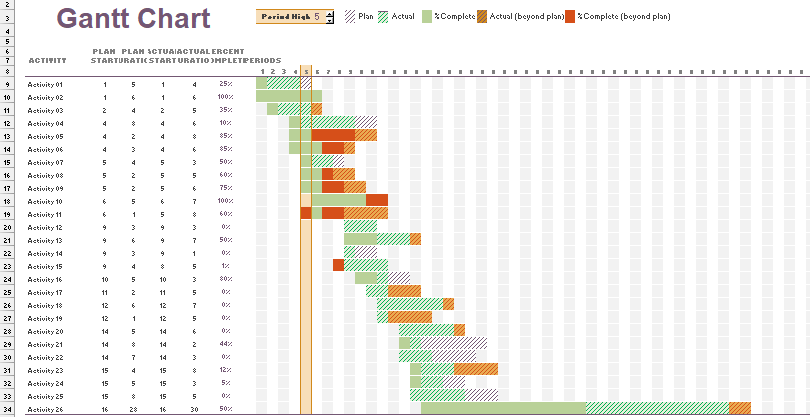
Gantt chart templates are useful tools for managing and scheduling projects in Excel. If you want to build a graph, you have two options. With a few steps, you can turn a simple bar chart into a Gantt Chart. In this case, Chart Formatting is important. As first, right-click on any of the bars on the chart to modify existing charts. Remove extra spaces between the graphs using the Gap Width. Another solution is based on conditional formatting. You can use different colors to highlight the task status.