Download our free Excel Gauge Chart Add-in and create advanced KPI dashboards quickly.
We want to introduce something special. From today, we provide a free add-in to boost your Dashboard. We hope you enjoyed the tool and saved a huge amount of time.
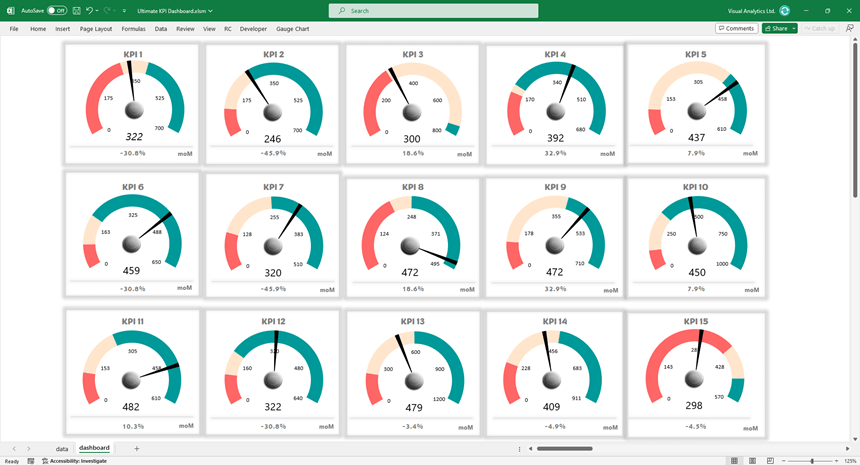
How to use the Gauge Chart Builder
After the installation, you’ll see the add-in on the ribbon:
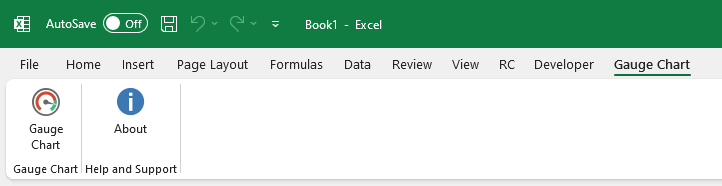
To create a new chart, follow these steps:
- Click the Chart icon
- Add a name to a chart
- Setup the zone values
- Link the actual value.
- Click the Create button.
You can use any number of gauges on a single Worksheet.