The following guide explains the basics of creating an Excel Chart and saving it as a template using a few easy steps.
Create chart templates using built-in Excel charts to change the default look of your graph. Our goal is simple: Build reusable charts for specific projects. We will explain all the steps to create, save, and manage a chart template based on custom graphs.
How to Save an Excel Chart as a Template
Keep in mind the following rules:
- Get rid of junk parts: The newly inserted chart contains unwanted elements. Using proper chart formatting, remove the extra legends, labels, borders, or grids.
- Create easy-to-read charts: To improve readability, format the chart first. For example, remove the background and decrease the gap between bars.
- Use a proper color scheme: “Less is more” when discussing colors.
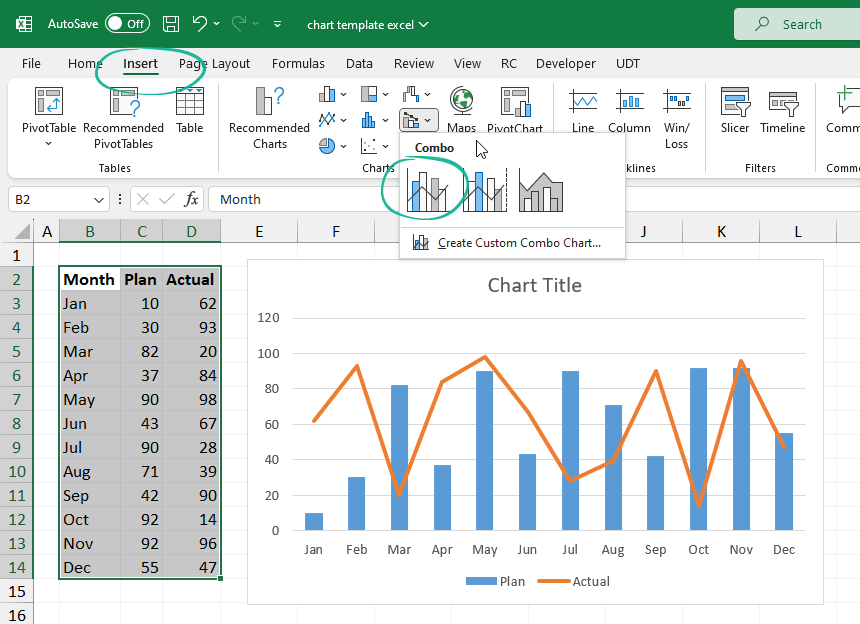
#1. Combine two chart types
The example will show you how to create a simple plan / actual chart using a line and a clustered column chart. First, select the data you want to display. In this case, we use the range B2:D14.
Locate the Insert Tab on the ribbon and click the Combo chart icon.
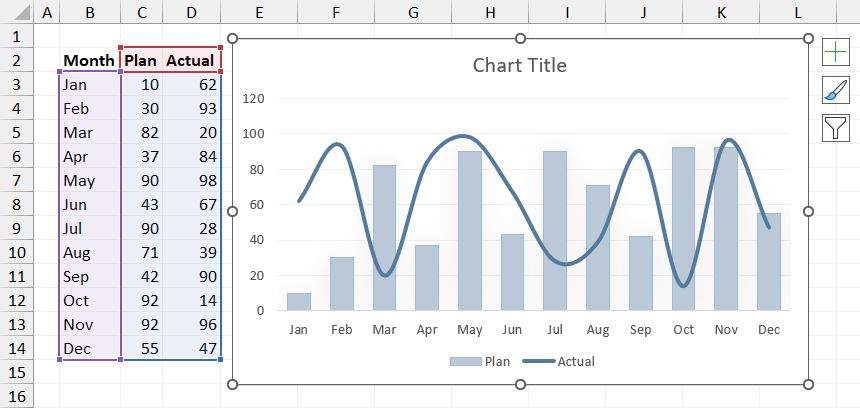
#2. Customize the Chart
Before saving a chart as a template, it is worth applying some formatting steps to improve the visual quality of the graph. You can customize the following properties:
- Chart Title
- Colors
- Gap with
- Axis
- Legends
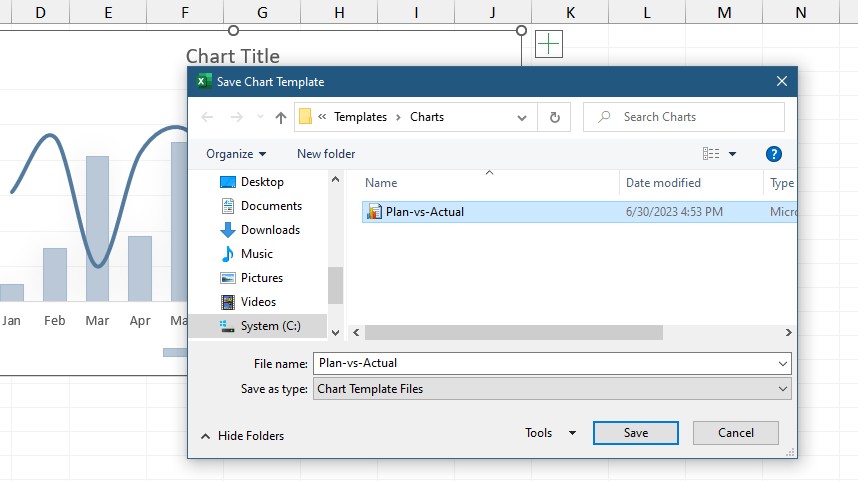
#3. Save a Chart as a Template
Steps to save a chart as a template in Excel:
- Right-click the selected chart, then select ‘Save as Template’.
- Add a name for the new template in the File name box.
- Click Save to save the chart as a chart template (*.crtx)
That’s easy! After that, open a new project: your saved chart template will appear and be ready.
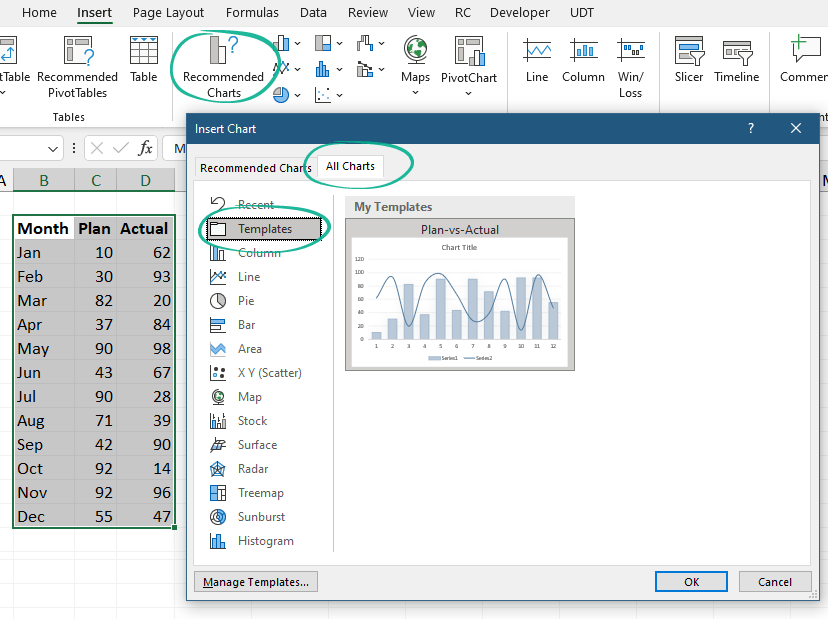
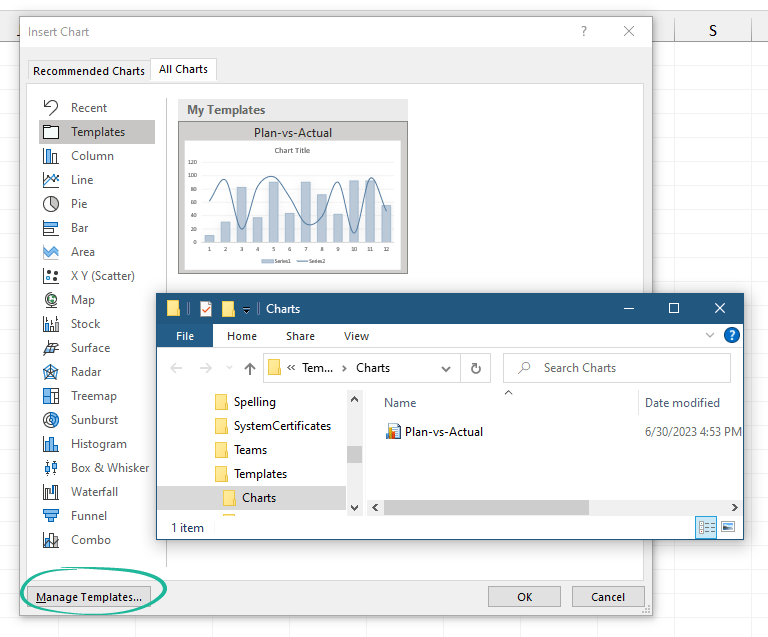
#4. Use the saved template
Now we have a saved custom graph; let’s see how to use it!
Steps to insert a chart template:
- Select the data that you want to display
- Click on ‘Recommended Charts‘ under the Insert Tab
- Select the All Charts Tab
- Choose the Template
- Click OK
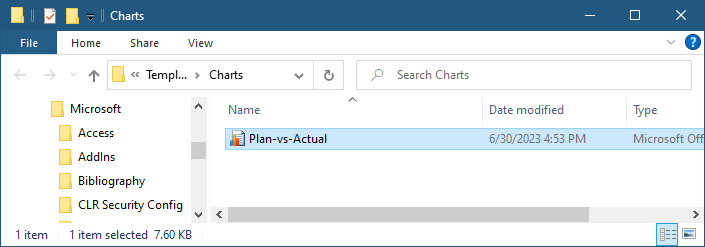
Where do I find chart templates in Excel? Excel will save all chart templates to your computer (local drive). You can find your prepared chart under the location below.
The default location is:
C:\Users\[username]\AppData\Roaming\Microsoft\Templates\Charts
Click the ‘Manage Templates’ button to get the Template Gallery from Excel. Delete the chart if it’s not necessary anymore.
Related articles: