In this tutorial, you will learn how to create an Income Statement using Sankey Diagram in Microsoft Excel.
What is an Income Statement?
The income statement, also known as the Profit and Loss (P&L) statement, is crucial for assessing a business’s financial health. It details revenue and expenses, revealing whether the company earns a profit or incurs a loss. Compared to the balance sheet and cash flow statement, the income statement usually stands out in earnings reports. It helps analyze a business’s profit and loss, providing a detailed financial overview.
If you are using Microsoft Excel, we often visualize Income statements using waterfall diagrams or bar charts. Waterfall diagrams represent each line item in the sequence, visually showing the impact of each expense on the revenue. The chart is informative; however, it sometimes requires time to explain.
Income Statement Template in Excel
Let’s analyze an income statement in Excel! In this example, we look at an Apple income statement. It begins with total revenues from different product lines, such as the iPhone, MacBook, iPad, Watch, AirPods, and Services, adding up to $394.6 million.
Next, direct costs tied to these revenues are subtracted. These costs include product cost ($201.5 million) and service cost ($22.1 million), leading to a cost of revenue totaling $223.6 million. After subtracting the cost of revenue from total revenues, we get a gross profit of $171 million.
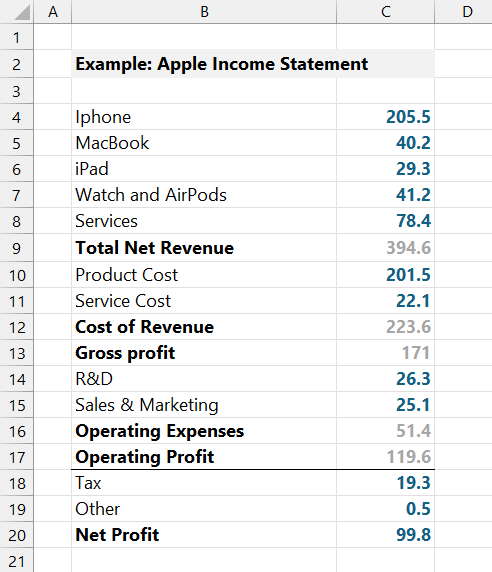
Following this, indirect expenses such as R&D (Research and Development) at $26.3 million and Sales & Marketing at $25.1 million are deducted, resulting in operating expenses of $51.4 million. When subtracting these operating expenses from the gross profit, we arrive at an operating profit of $119.6 million.
Finally, other expenses like taxes ($19.3 million) and other costs ($0.5 million) are subtracted from the operating profit to determine the net profit, which amounts to $99.8 million. This net profit indicates the company’s profitability, and comparing the net margin helps assess the company’s performance against industry peers.
Income Statement visualization using Sankey Diagram
Let’s see what happens when we convert our raw data table into a Sankey Diagram.
Take a closer look at Apple’s Income Statement. The diagram is an excellent visualization tool for income statements because it clearly illustrates where the money comes from, where it goes, and how each part affects the final profit or loss. It uses flowing lines of different widths to represent the size of various financial components, making it easy to see the relationships between revenues, costs, and profits at a glance.
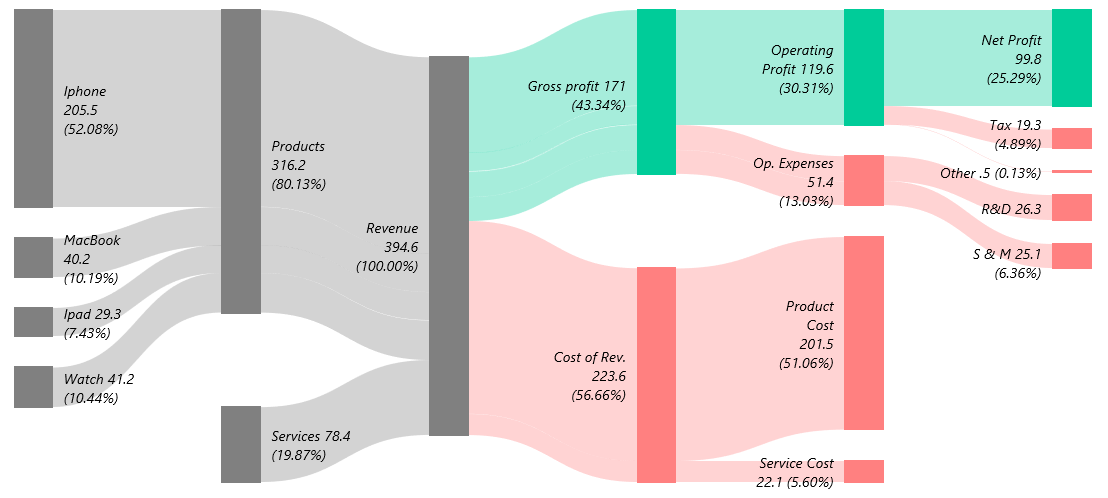
The main advantage of a Sankey diagram is its ability to show proportions and flows. In this income statement, the diagram reveals how revenue is divided among different products and services. It shows how much each one contributes to the total income. The diagram then visually tracks the flow of money through direct costs, gross profit, operating expenses, and net profit.
This flow-based approach makes it easier to spot the most significant cost drivers. It also helps identify potential areas for cost reduction and key contributors to profitability.
How to transform an Income Statement into a Sankey Diagram
Steps to convert an income statement into a Sankey Diagram:
- Install the Sankey diagram Add-in for Excel.
- Prepare data and create a table.
- Click the Sankey Income statement icon.
- Adjust the settings for the diagram.
- Click OK to create the diagram.
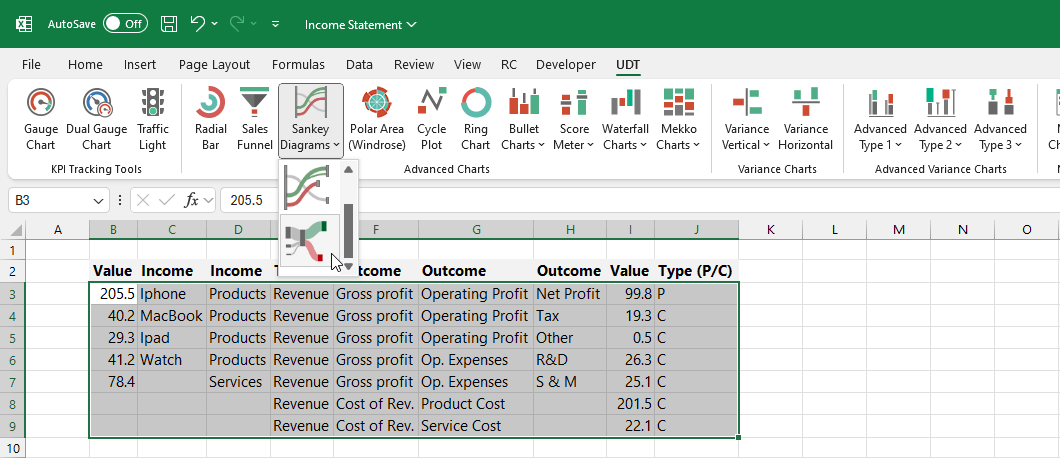
Ensure that the sum of the values on both sides (in this example, Column B and Column I) is equal. The ‘P’ and ‘C’ flags indicate whether the branch represents a profit (‘P’) or a loss (‘C’).
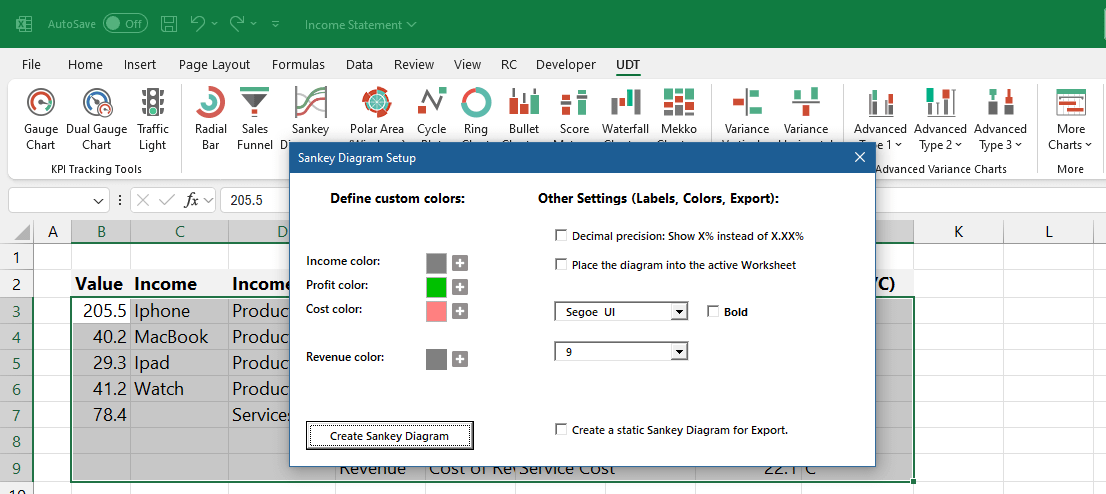
Before generating the Sankey Diagram, several customization options are available:
- Custom Colors: Users can define specific colors for different diagram components. This includes setting the colors for income, profit, cost, and revenue. Each category can have a distinct color to enhance the visual representation and make the diagram easier to interpret.
- Decimal Precision: Users can adjust how percentages are displayed. They can choose to show percentages as whole numbers (e.g., “50%”) instead of displaying decimal precision (e.g., “50.00%”).
- Placement: The diagram can be placed directly into the active worksheet where the data resides, ensuring it is easily accessible and visible alongside the original data.
- Font Settings: Users can customize the font used for the labels in the diagram. Options include changing the font type and size and making the text bold for better readability.
- Static Diagram Creation: There is an option to create a static version of the Sankey Diagram for export purposes. This allows for sharing or embedding the diagram in other documents without any interactive elements.
The Sankey Diagram transforms the Income Statement into a visual flow, making it easier to understand how revenue and costs impact profitability. Try it and see how transforming numbers into visual flows can bring your data to life.
Download the template
You can take a closer look at how effective the Sankey Diagram is for analyzing an income statement. The downloadable file contains two examples. It is important to note that these are exported final results, and dynamic switching between diagram levels is only available in the add-in.