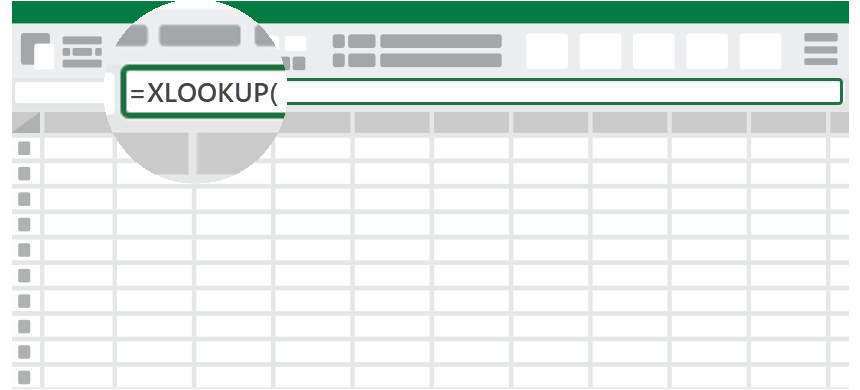
Left lookup in Excel using XLOOKUP
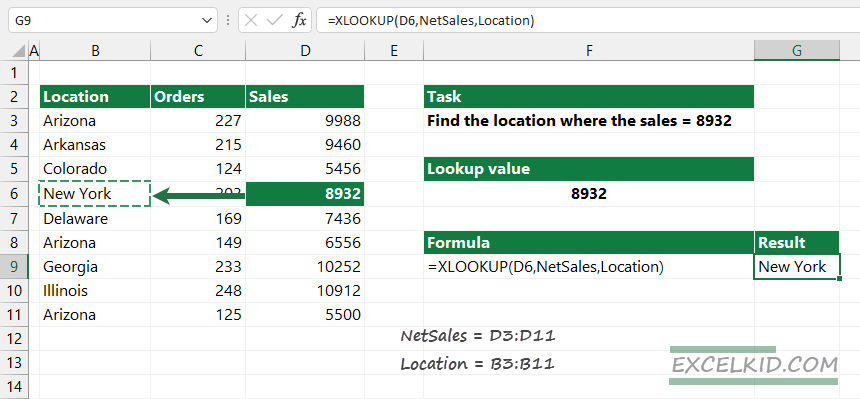
Learn how to easily perform a left lookup with the XLOOKUP function instead of using the VLOOKUP or INDEX and MATCH functions.
Learn how to easily perform a left lookup with the XLOOKUP function instead of using the VLOOKUP or INDEX and MATCH functions.

Learn how to calculate probability in Excel using the PROB function with or without the upper limit.
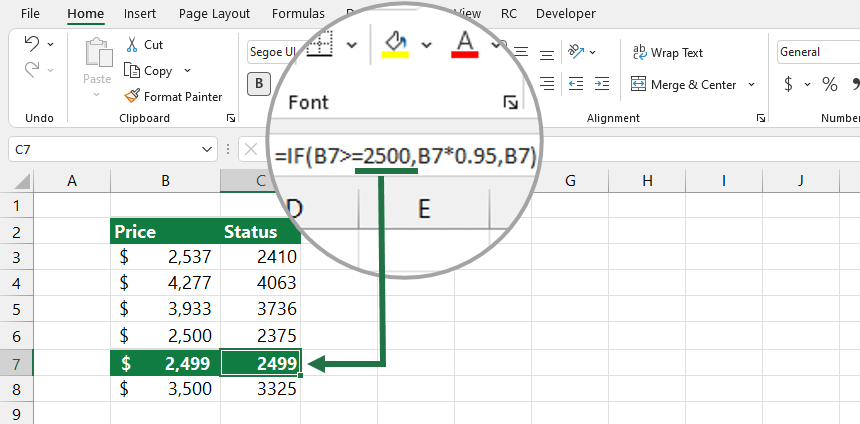
In Excel, the greater than or equal to (>=) logical operator compares two cells that contain the same data types.
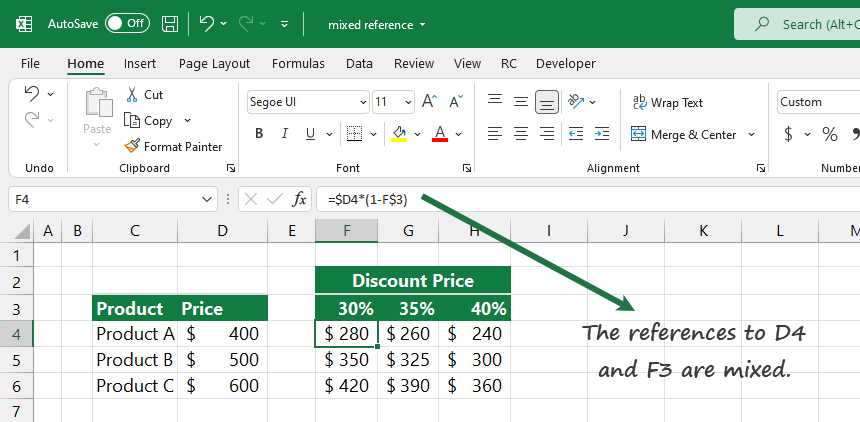
Learn how to use a mixed reference in Excel to split the references into absolute and relative parts through examples.
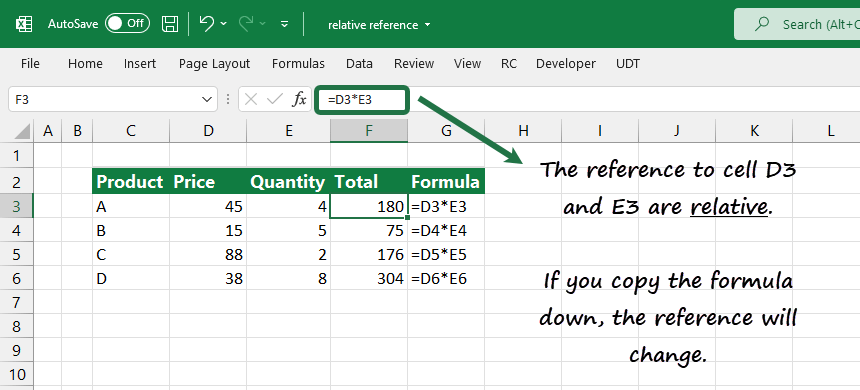
A relative reference in Excel points to a cell or range address, and it changes when you copy the formula to another cell.

Learn how to create a multi-layer doughnut chart in Excel using advanced data visualization for dashboards and reports.

Use logical operators in Excel to compare values. The output is true or false, depending on whether or not the conditions match the criteria.

The Name Box in Excel is placed on the left side of the formula bar. Learn how to use names in your Workbook!
Learn all about the Excel Formula Bar. Look at how to use, expand, show, and hide quickly through examples.
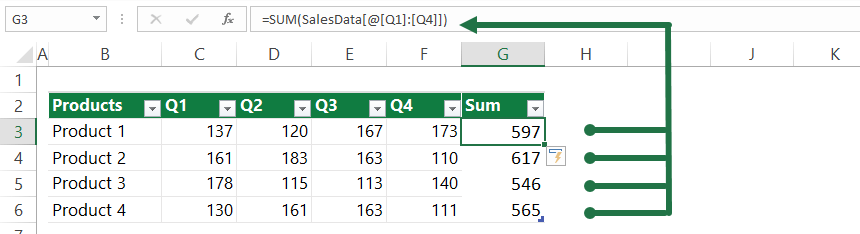
Excel structured reference is a syntax that applies table names in easy-to-read formulas instead of regular cell references.

The tutorial shows how to use the subtraction formula in Excel. Learn how to subtract numbers, percentages, dates, and times easily.

Learn how to fix issues in Excel when one or more formula references in the worksheet cause errors during saving, modifying, or opening.
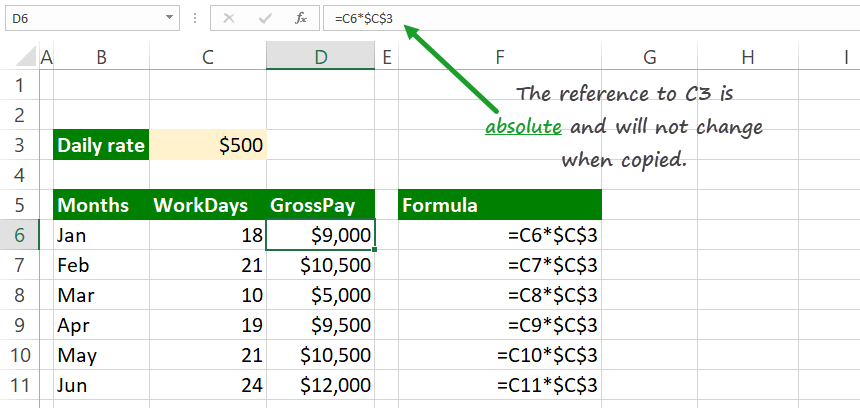
An absolute reference in Excel is a powerful tool that locks your formula to a specific cell or range of cells.

In this tutorial, you will learn how to add leading zeros in Excel in front of a number using the ZFILL function.

Today’s tutorial will explain how to remove special characters in Excel using the most efficient functions and formulas.

You can count cells based on color using a custom formula in Excel. In the example, we’ll show you how to do that!

Learn how to create an Excel dumbbell chart (dot plot) to emphasize the change between two points across multiple categories.

This step-by-step tutorial will show you how to create a Quadrant chart in Excel to support SWOT analysis. Based on your criteria, we use the Quadrant chart to split values into four equal (and distinct) quadrants.

Learn how to build a forecast chart in Excel! It is a custom combination chart with one column and two line charts.

This tutorial will show you how to create a radial bar chart in Excel using stunning visualization to compare sales performance.
Dynamic charts in Excel help us to improve the quality of data visualization by allowing users to update and interact with data.

Today’s guide will explain how to create a Marimekko Chart in Excel 2007, 2010, 2013, 2016, 2019, and Microsoft 365 to display market segmentation maps using easy-to-understand visualization.

Use Excel Tables to simplify your work! Learn how to create dynamic ranges with easy-to-read formulas using tables.

Our definitive guide will show you 15 ways to clean data in Excel. Learn more about data cleansing through useful examples.
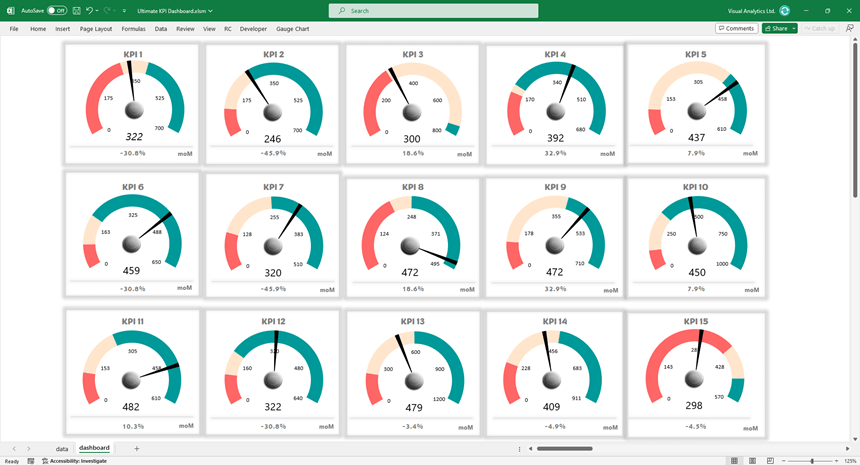
The Gauge Chart Add-in is a powerful tool for creating advanced Key Performance Indicator (KPI) dashboards in Excel.
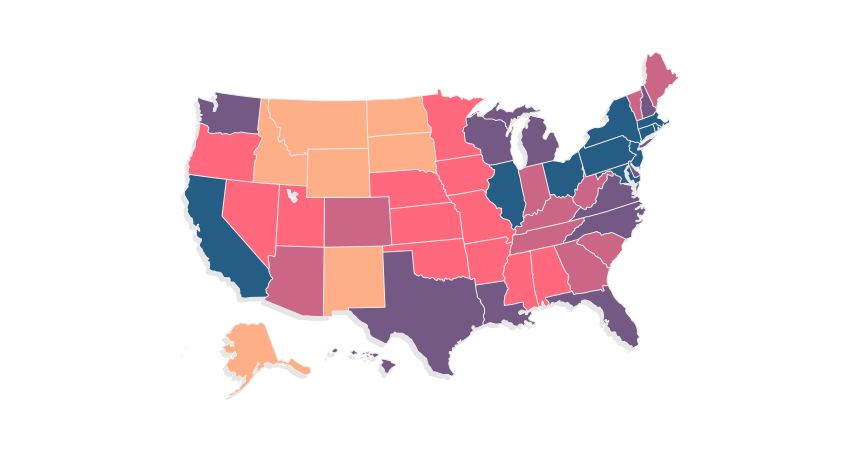
The tutorial provides a detailed guide on creating state map to visualize data.