Use a Product Metrics Dashboard Template in Excel to track and monitor your sales performance by years, regions, and sales representative.
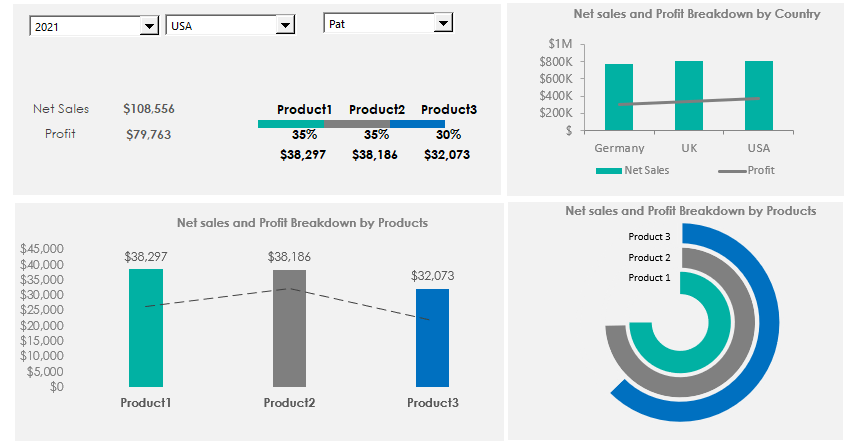
It is good to know dashboard templates are essential when you want to use data to tell a story. We aim to display the Net Sales and Profit and show a breakdown by country and product based on the selected person. The product metrics template lets you show key information on a single screen. Furthermore, it plays an important role: it supports decision-making.
Product Metrics Dashboard: Overview
It is worth splitting the template into two or more separate sections for better readability. We are also following the rules regarding colors. Use the right chart types and colors, making the sales activity easy to track.
Form controls play an important role: you can analyze and show a large amount of data without any trouble. Furthermore, you can filter the data using a drop-down list and show only the selected records group. Net Sales and Profit are the main metrics we will create custom breakdowns using column and radial bar charts.
Dynamic template using Drop-down lists
In the top-left area of the product metrics template, you can find the drop-down list-based navigation area that controls the data filtering. The drop-down list works like a trigger.
You can use three variables: Year, Country, and SalesRep. Because we are discussing a dynamic template, all charts will be updated in real-time.
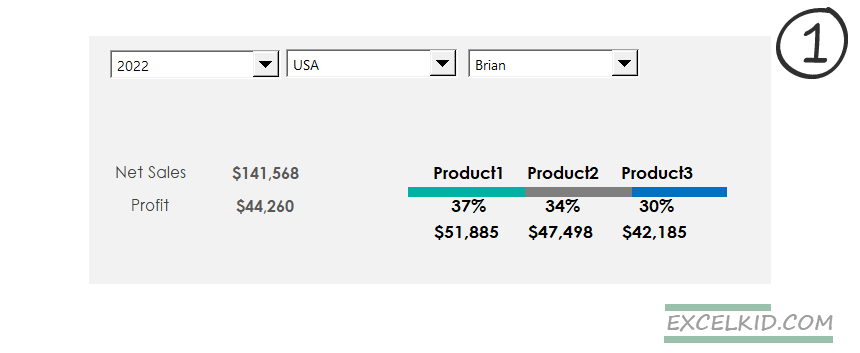
In the example, the current selection is the following: Choose the sales year (2022), find the products in the USA, and select Brian from the sales reps list. In this case, the net sales are $141 568, and the profit is $44 260.
Take a closer look at the product-level breakdown! The chart provides information on the contribution of each sales representative concerning the products.
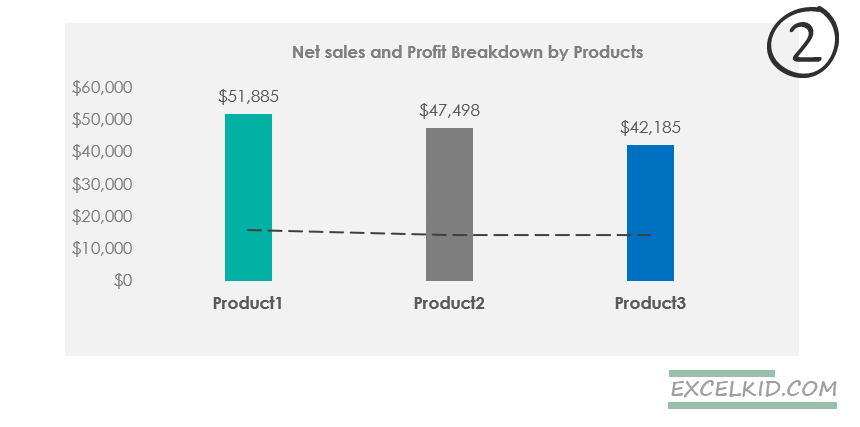
Product Level Resolution: Net Sales vs. Profit
The next part of the product metrics template displays the products using a Net Sales and Profit comparison chart. We use a column chart to visualize the Net sales and apply a dotted line chart to show the profit per product.
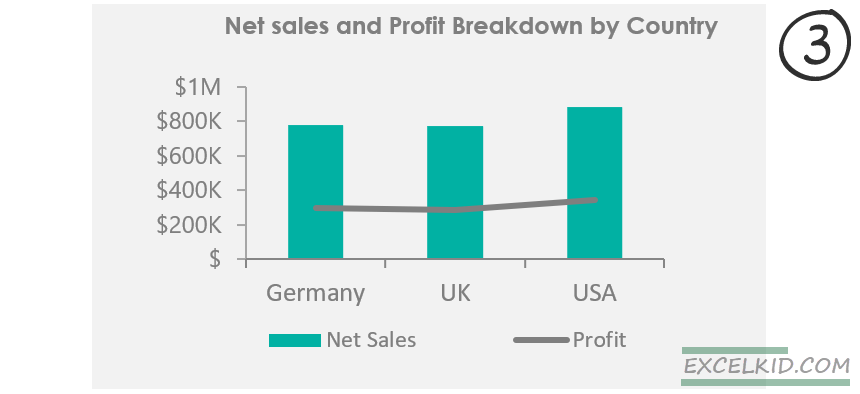
Product Metrics: Breakdown by Country
Create a small combo chart to show the key metrics by region. In this case, it is worth using a combination chart. The country-level resolution clearly shows the sales performance differences between countries using the selected sales representative.
If you want to look closely at your sales activity, we strongly recommend using a sales funnel chart.
Calculations: Formulas and Functions
It is time to take a look under the hood. First, select the Calculation Worksheet to analyze the calculation steps. Next, the OFFSET function finds the selected drop-down list values based on Year, Country, and Sales rep.
The formula in C1:
=OFFSET(E3, E2,0)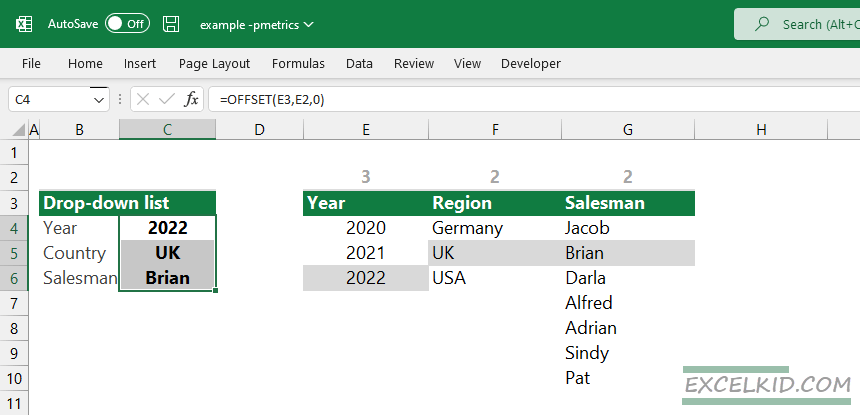
The SUMIFS function sums up values based on multiple conditions. Let us see how we calculate the Net Sales and Profit based on the selected variables.
For example, here is the formula for Product 1:
=SUMIFS(data!$H:$H,data!$B:$B,">="&DATE(calc!$C$4,1,1),data!$B:$B,"<="&DATE(calc!$C$4,12,31),data!$F:$F,calc!$C$5,data!$E:$E,calc!$C$6,data!$D:$D,calc!C$12)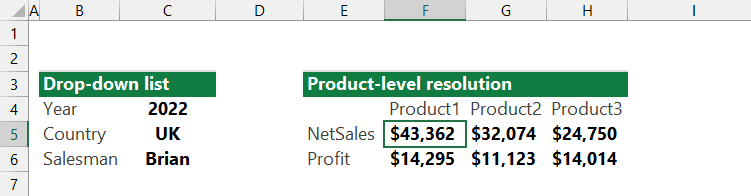
So, the formula jumps to the data Worksheet and lookup Product 1. After that, find the selected date in the ‘Dates’ column, then look for the UK in the ‘Country’ column. Finally, it applies the third condition and gets ‘Brian’ from column E.
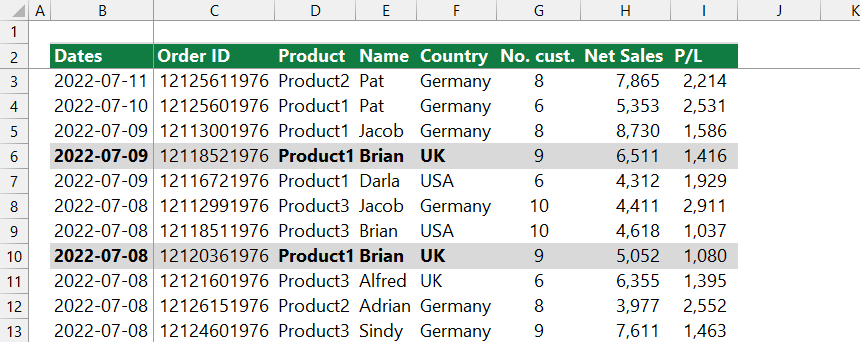
You can calculate the metrics for Product2 and Product3 using the formula above.
Download the practice file and stay tuned.
Additional resources: