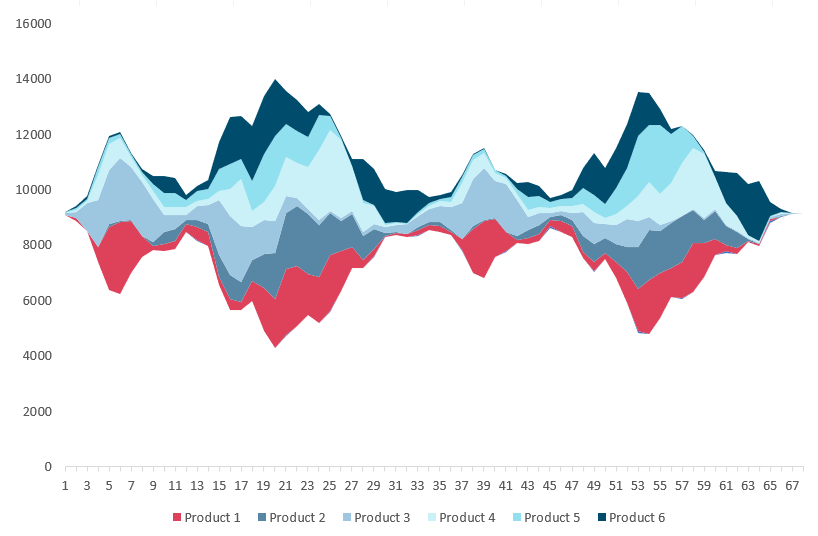
The Stream Graph in Excel is ideal for displaying high-volume datasets and discovering trends and patterns across various categories over time.
The following chart is a part of our chart templates series. Before we take a deep dive into the details, prepare the data.
Steps to create stream graph in Excel
For better readability, we split the process into easy-to-understandable parts.
Prepare data and insert a stacked area chart
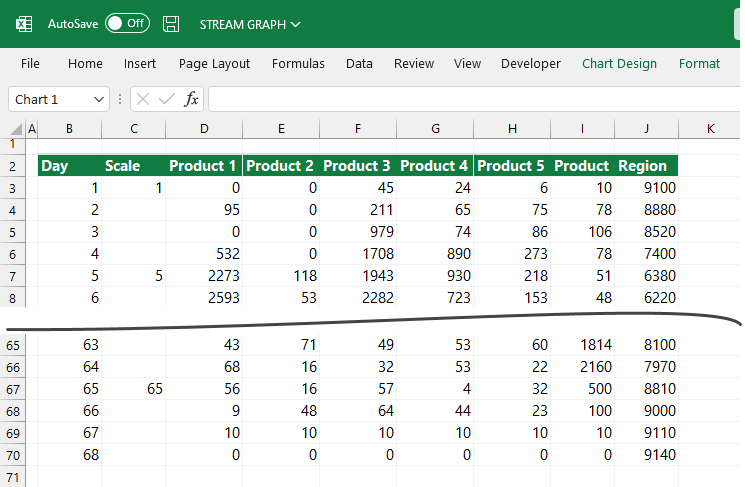
We want to display 6 products using the stream graph in the example. In column C, we need to create a custom scale that uses five-day intervals for better chart readability.
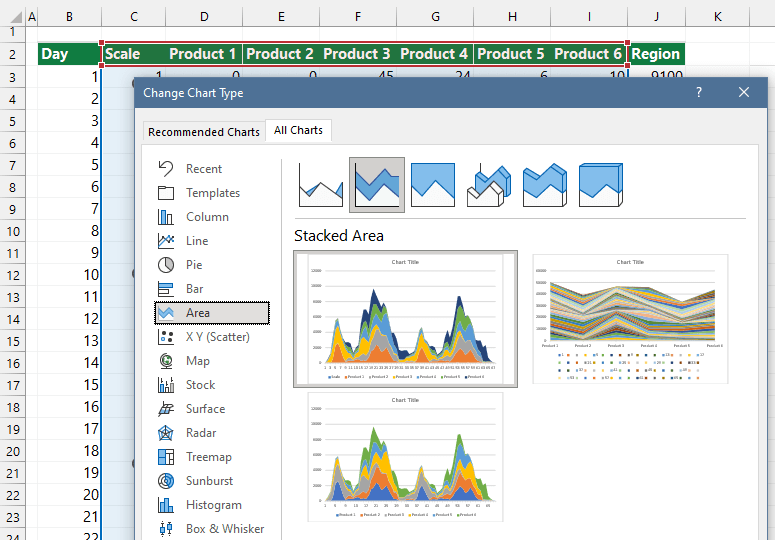
First, select the range that contains the sales of each product. Next, click the Insert Tab on the ribbon and select ‘Insert Recommended Chart‘. Next, use the ‘All Charts‘ tab under the ‘Change Chart Type‘ group. Finally, choose the chart you want to use. In the example, select the ‘Stacked Area‘.
Add dummy series to the Stream Graph
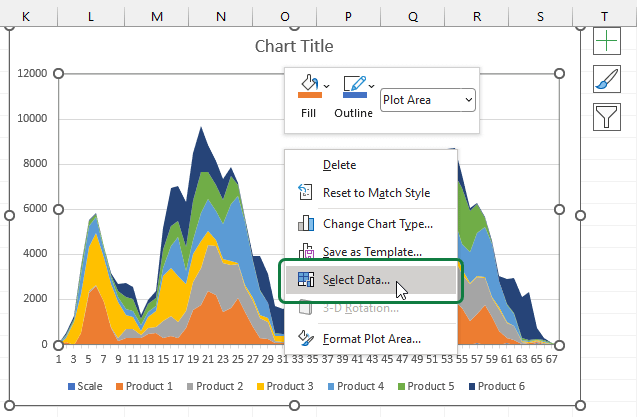
Now we have a stacked area chart that shows the sales by categories (products). Right-click on the chart area and click ‘Select Data‘.
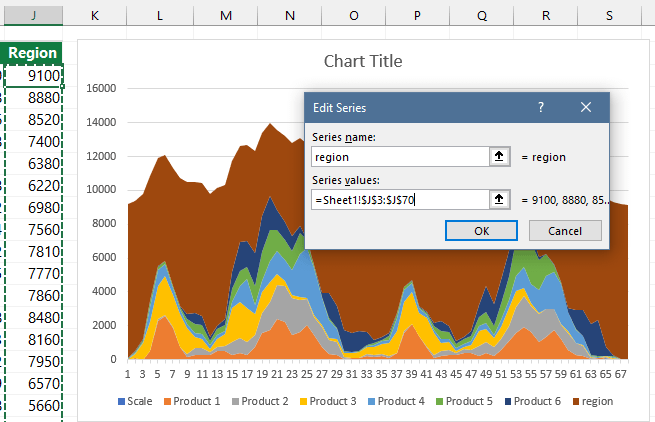
Insert a new column, and add a descriptive name, for example, ‘Region‘. Then, we will create a dummy series for the area chart using the formula above. The goal of this chart is to create a better position for the final chart.
The raw data table contains a formula in cell J3:
=CEILING($L$2-SUM(D3:I3)/2+$L$3,10)Copy the formula down! The next step is to add a new series to the current chart. In the ‘Edit Series‘ dialog box, select the J3:J70 range and click OK to close the window.
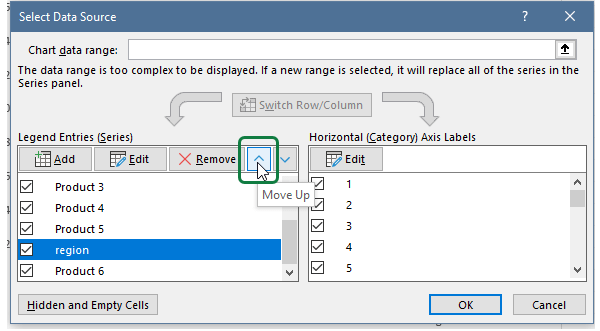
Now we will change the dummy series position. To do that, follow the steps below:
- Right-click on the chart area
- Click ‘Select Data‘
- Select the ‘Range‘ series
- Move the selected series up (to the top) by using the arrow icon
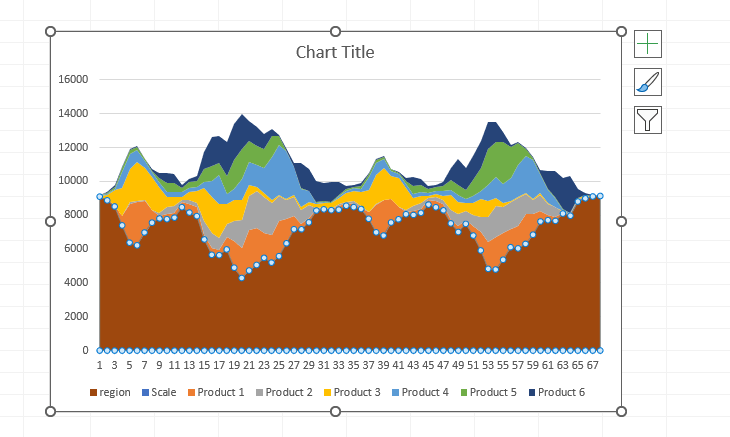
The improved stream graph looks like this:
Clean up the chart
To make the dummy chart invisible, select the series and apply ‘No fill’. Finally, choose your preferred color theme for the different products.
Finally, clean up the chart: remove borders and all other unnecessary elements.

Additional resources