Learn how to create a social media dashboard in Excel using our ready-to-use framework and stunning data visualization. This tool enables you to create various free templates in a short time.
If you have a Youtube channel, this guide is for you! This subject has become timely in the past years because everyone is interested in what kinds of social channel activity metrics can generate.
If there are many visitors from social media on your site, your channel can be popular quickly. We cannot overlook that this can also have a positive financial impact.
First, take a closer look at the social media dashboard. We have chosen a classic grid layout to display 12 key Youtube metrics that belong to each major social media. Learn more about dashboard design and check out our latest dashboards.
Our framework lets you stay on top of social media analytics from your favorite channels. Just replace your key metrics.
You can create various reports for Twitter, Pinterest, or Facebook analytics.
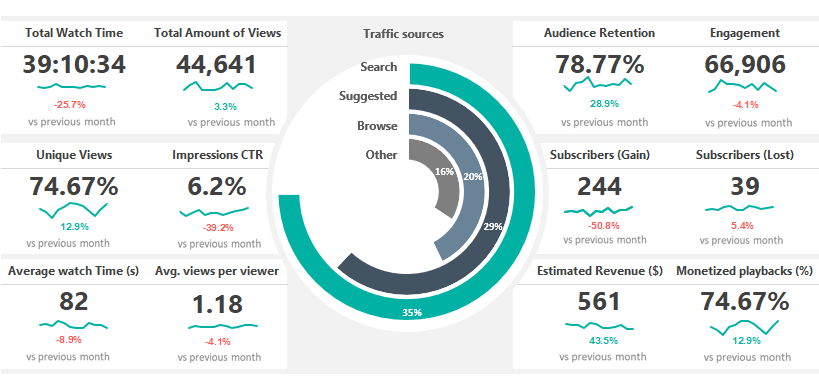
Social Media Dashboard – Metrics
We’ll track the following social media-related key performance indicators:
- Total Watch Time
- Total Amount of Views
- Unique Views
- Impressions CTR
- Average watch Time (s)
- Average views per viewer
- Audience Retention
- Engagement
- Subscribers (Gain)
- Subscribers (Lost)
- Estimated Revenue ($)
- Monetized playbacks (%)
Discover the Structure
You can use old-school solutions in Excel, but we can come up with something completely new that you have never seen before. We have chosen the latter; it is worthwhile to do the same if you want to impress your audience.
Please look at the Workbook structure; it is clean and straightforward.
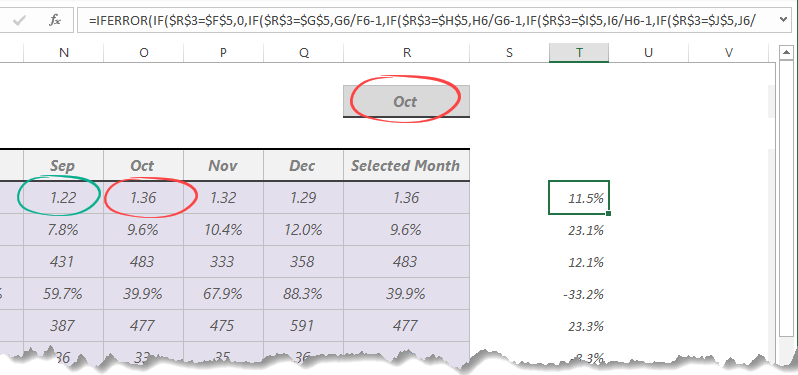
The Data Sheet: Calculate the variance
First, you can add your data to the Data Worksheet. Then, we’ll apply a nested IF formula. We can use this formula to identify and display the variance between the selected month and the previous month.
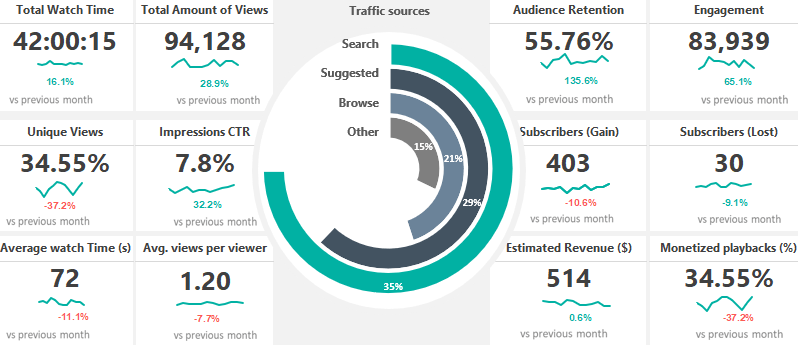
Build a Drop-down list
Let us see the dashboard sheet! If you need a monthly breakdown for your dashboard, the best choice is to create a drop-down list, nothing special, which we have used many times. We have chosen 12 social media metrics.
Let’s examine these in the given period. We have already discussed the menu in the upper right-hand corner of the template.
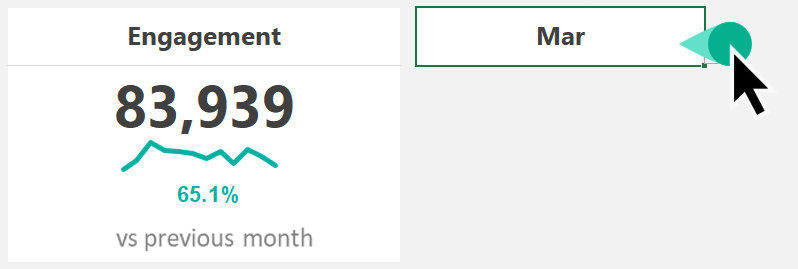
Create a Scorecard for Social Media Dashboard
Now we have to talk about the core component of our dashboard. First, let us see the data behind the widget.
- First, add a data label for the widget.
- After that, link the data from the Data Worksheet to the main Dashboard sheet.
- Create a simple line chart.
- Select the source range. Browse the cell which contains the actual value. We’ll get and display an annual trendline.
- Finally, link the variance from the calculation sheet.
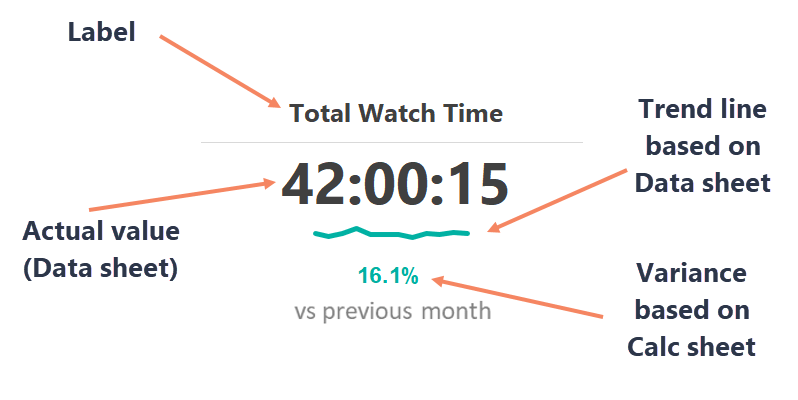
Repeat these steps for every widget.
We have linked the scorecards to the calculated values on the data worksheet. Therefore, all cards will be updated when you change the months in the drop-down list.
That’s all!
Apply Conditional Formatting
Jump to the calculation sheet! Next, we’ll apply conditional formatting. First, select the cell, click the Home tab, and select conditional formatting.
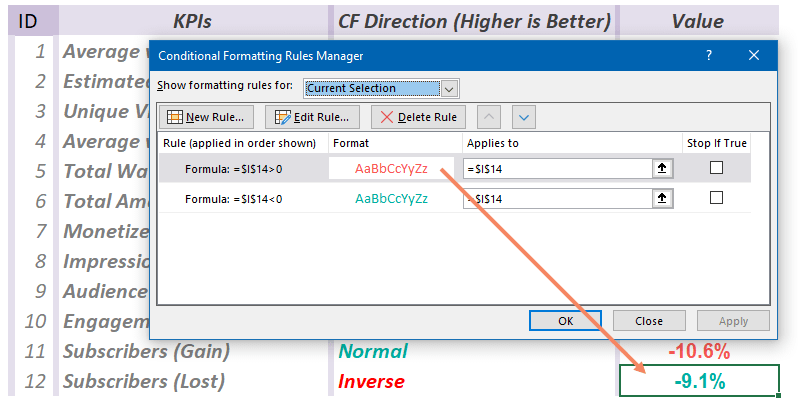
Create new rules for the current selection. For example, we can display the positive values in green and the negative values in red.
TDon’ton’t forget: Some metrics have inverse characteristics, for example, ‘Subscriber List.’
Okay, back to the Dashboard sheet. Create a custom radial bar chart manually or use a chart add-in for data visualization purposes for the main metrics.
Choose an impressive chart type to display your most important YouTube metrics.
Social Media Dashboard – Final Words
Allow us a little Excel-related detour, so please don’t skip over it. One of the news media blogs has asked the currently best Excel professionals what they think about the relationship between BI and Excel.
That’s why web-based solutions are on the rise, and the newest business intelligence tools of Microsoft Excel (Power BI, Power Query) are increasingly emphasized.
Then again, all professionals harmoniously stated that Excel would be our colleague in everyday work. Therefore, we recommend using custom productivity tools and free Excel add-ins.
So, more haste, less speed.
Of course, it is all free of charge and will not change in the future. However, more novelty will await you, so you should often visit the site for the newest Excel tips and news.
Subscribe to our Youtube channel and publish dashboard how-tos frequently.
Stay tuned.
Additional resources:
- Heat Map-based Social Media Report (Download)
- Create a dynamic SM template
- Financial Dashboard Template
- Create a layout for your report